Fihser Classifier#
Provided by Javad Saghi
Contact: jav.saghi@gmail.com
The Fisher classifier, often referred to as Fisher’s Linear Discriminant (FLD) or Linear Discriminant Analysis (LDA), is a method used in statistics, pattern recognition, and machine learning to find a linear combination of features that characterizes or separates two or more classes of objects or events.
Consider a binary classification problem with two classes: \(C_1\) and \(C_2\). Each sample \(x\) belongs to one of these classes. We aim to find a projection vector \(w\) such that the projection of samples onto this vector maximizes the seperation between the two classes. as following image:
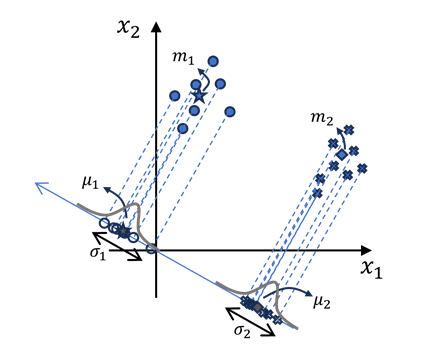
In this projection we have: $\( y = \vec{\bold{w}}^\top \vec{\bold{x}} + b \)$
First moment of samples after projecting them onto this vector would be: $$ \mu_1 = \mathbb{E} \left{y | \omega_1 \right} = \mathbb{E} \left{\bold{w}^\top \bold{x} | \omega_1 \right} + \mathbb{E}\left{b \right} \
\mu_2 = \mathbb{E} \left{y | \omega_2 \right} = \mathbb{E} \left{\bold{w}^\top \bold{x} | \omega_2 \right} + \mathbb{E}\left{b \right} $$
We’ve considered that \(w\) to be a determinestic parameter, therefore: $$ \mu_1 = \bold{w}^\top \underbrace{\mathbb{E} \left{\bold{x} | \omega_1 \right}}{m_1} + \underbrace{\mathbb{E}\left{b \right}}{b} \Rightarrow \boxed{\mu_1 = \bold{w}^\top \bold{m_1} + b} \
\mu_2 = \bold{w}^\top \underbrace{\mathbb{E} \left{\bold{x} | \omega_2 \right}}{m_2} + \underbrace{\mathbb{E}\left{b \right}}{b} \Rightarrow \boxed{\mu_2 = \bold{w}^\top \bold{m_2} + b} $$
We’ve come to the coclusion that “the first moment of projected samples” is equal to “projection of the first moment of samples”.
Mean and Variance in Projection Sapce#
Second moment of samples after projecting them onto this vector would be: $\( \sigma_1^2 = \mathbb{E} \left\{ \left( y-\mu_1 \right)^2 \vert \omega_1 \right\} \\ = \mathbb{E} \left\{ \left( \bold{w}^\top \left( x - \bold{m_1} \right) \right)^2 \vert \omega_1 \right\} \\ = \mathbb{E} \left\{ \left( \bold{w}^\top \left( x - \bold{m_1} \right) \right) \left( \bold{w}^\top \left( x - \bold{m_1} \right) \right)^\top \vert \omega_1 \right\} \\ = \bold{w}^\top \underbrace{ \mathbb{E} \left\{ \left( x - \bold{m_1} \right) \left( x - \bold{m_1} \right)^\top \vert \omega_1 \right\} }_{\Sigma_1} \bold{w} \\[10px] \Rightarrow \boxed{\sigma_1^2 = \bold{w}^\top \Sigma_1 \bold{w}} \)$
Similarly we can derive that: $\( \boxed{\sigma_2^2 = \bold{w}^\top \Sigma_2 \bold{w}} \)$
within-class and between-class scatter#
Define the within-class scatter matrix \(S_W\) and the between-class scatter matrix \(S_B\).
Within-Class Scatter Matrix#
We need to minimize \((\sigma_1^2 + \sigma_2^2)\) $\( \min{\left(\sigma_1^2 + \sigma_2^2 \right)} \rightarrow \min{ \left(\bold{w}^\top \Sigma_1 \bold{w} + \bold{w}^\top \Sigma_2 \bold{w} \right)} \\[5px] \rightarrow \min{ \bold{w}^\top \underbrace{\left( \Sigma_1 + \Sigma_2 \right)}_{S_W} \bold{w} } \\[5px] \rightarrow \min{\bold{w}^\top S_W \bold{w}} \)$
Between-Class Scatter Matrix#
Also we need to maximize \( (\mu_1 - \mu_2)^2 \) $$ \max{(\mu_1 - \mu_2)^2} \rightarrow \max{ \left( \left( \bold{w}^\top \bold{m_1} + b \right) - \left( \bold{w}^\top \bold{m_2} + b\right)\right)^2} \[5px]
\rightarrow \max{ \left( \left( \bold{w}^\top \bold{m_1} - \bold{w}^\top \bold{m_2} \right) \left( \bold{w}^\top \bold{m_1} - \bold{w}^\top \bold{m_2}\right)^\top \right)} \[5px]
\rightarrow \max{ \left(\bold{w}^\top \underbrace{\left(\bold{m_1} - \bold{m_2} \right)\left( \bold{m_1}^\top - \bold{m_2}^\top \right)}_{S_B} \bold{w} \right)} \[10px]
\rightarrow \max{ \bold{w}^\top S_B \bold{w}} $$
Objective Function#
We need to maximize the between-class scatter and minimize the within-class scater.
The objective is to minimize the following expression:
By setting the derivative respect to w equal to zero we get:
We know that \(S_B\) and \(S_W\) are symmetric, so \(S_B^\top = S_B\) and \(S_W^\top = S_W\).
Because the lengh of \(w\) does not matter, we can ignore the scaler part.
from matplotlib.markers import MarkerStyle
import matplotlib.pyplot as plt
import numpy as np
from sklearn.datasets import make_classification


# create a dataset
dataset_x, dataset_y = make_classification(n_samples=50,
                                           n_features=2,
                                           n_informative=2,
                                           n_repeated=0,
                                           n_redundant=0,
                                           n_classes=2,
                                           n_clusters_per_class=1,
                                           class_sep=4.0)


# show the dataset
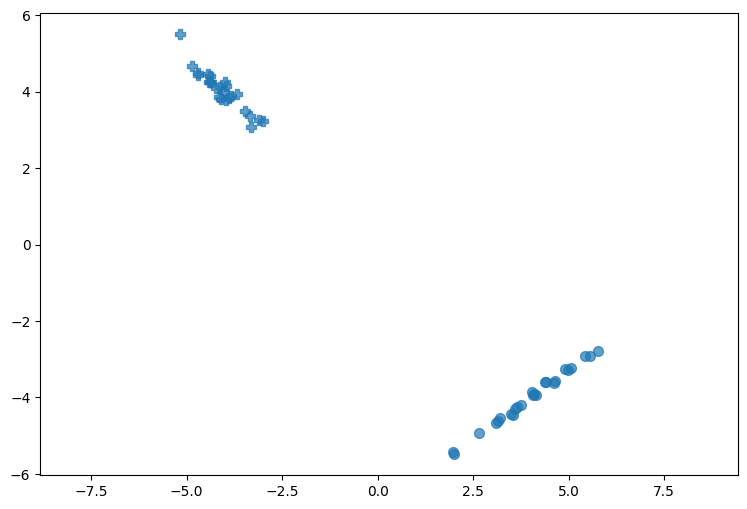
plt.figure(1, figsize=[9, 6])
plt.axis('equal')
markers = ['o', 'P']
for i, marker in enumerate(markers):
    plt.scatter(dataset_x[dataset_y==i, 0],
                dataset_x[dataset_y==i, 1],
                marker=marker,
                s=50,
                alpha=0.7,
                c='tab:blue')
# calculate m1 and m2
m1 = np.mean(dataset_x[dataset_y==0], axis=0).reshape([-1, 1])
m2 = np.mean(dataset_x[dataset_y==1], axis=0).reshape([-1, 1])

# show m1 and m2
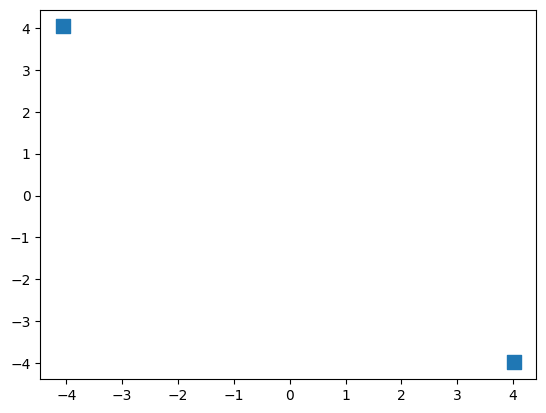
plt.scatter(m1[0], m1[1], marker='s', c='tab:blue', s=90);
plt.scatter(m2[0], m2[1], marker='s', c='tab:blue', s=90);

# calculate SB
SB = (m1 - m2) @ (m1.T - m2.T)

# calculate the covariance of each class
sigma1 = np.cov(dataset_x[dataset_y==0], rowvar=False)
sigma2 = np.cov(dataset_x[dataset_y==1], rowvar=False)

# calculate SW
SW = sigma1 + sigma2
Obtaining Parameter#
Calculating w using following equation:
# calculate w
w = np.linalg.inv(SW) @ (m2 - m1).reshape(-1)
w = w / np.linalg.norm(w)

# project dataset onto the vector 'w'
p_dataset_x = ((dataset_x @ w) * w.reshape(-1, 1)).T

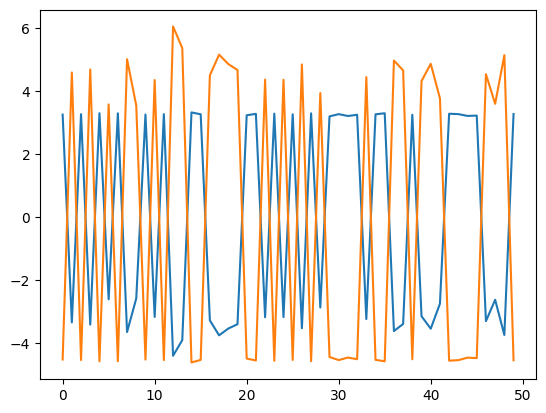
plt.plot(p_dataset_x)
[<matplotlib.lines.Line2D at 0x22379bf8cd0>,
 <matplotlib.lines.Line2D at 0x22379bf8e10>]
Bias claculation#
Then we calculate parameter \(b\) using a huristic method.
# calculate b
mu1 = np.mean((dataset_x[dataset_y == 0] @ w), axis=0)
mu2 = np.mean((dataset_x[dataset_y == 1] @ w), axis=0)
b = np.mean([mu1, mu2])
print(b)
0.0353255607200067
show results#
# show dataset
plt.figure(1, figsize=[9, 6])
plt.axis('equal')
markers = ['o', 'P']
for i, marker in enumerate(markers):
    plt.scatter(dataset_x[dataset_y==i, 0],
                dataset_x[dataset_y==i, 1],
                marker=marker,
                s=50,
                alpha=0.7,
                c='tab:blue')

# show projected data
markers = [MarkerStyle('o', fillstyle='none'),
           MarkerStyle('P', fillstyle='none')]
for i, marker in enumerate(markers):
    plt.scatter(p_dataset_x[dataset_y==i, 0],
                p_dataset_x[dataset_y==i, 1],
                marker=marker,
                s=50,
                alpha=0.6,
                c='tab:blue')


# show w direction
plt.arrow(w[0]*b, w[1]*b, w[0], w[1], head_width=0.35)

print('w: ')
print(w)
print('b: ')
print(b)

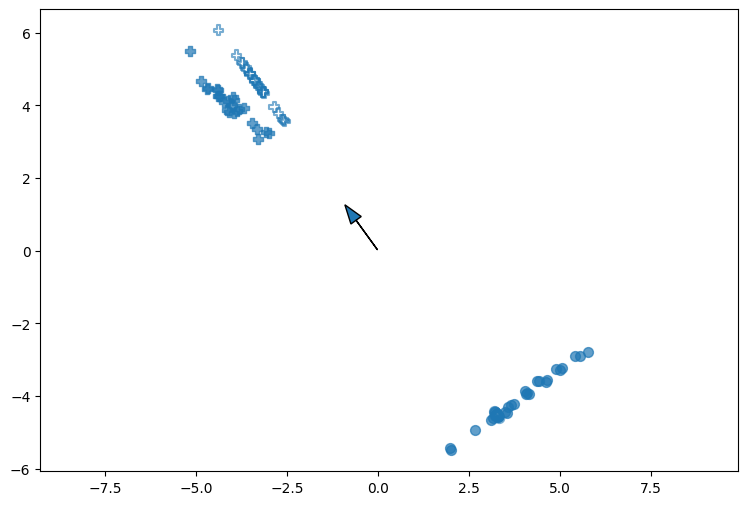
plt.show()
w:
[-0.58652963  0.80992777]
b:
0.0353255607200067
